Equipos de investigación explicando redes que evolucionan
Mostrá cómo cambian relaciones, clústers o comportamientos a lo largo del tiempo para que quienes leen entiendan el hallazgo antes de ir al paper completo.
Casos de uso
Quienes trabajan con gráficos dinámicos suelen querer explicar una secuencia de eventos, no solo mostrar un gráfico final. Ahí es donde el relato visual tipo cómic marca la diferencia.
Mostrá cómo cambian relaciones, clústers o comportamientos a lo largo del tiempo para que quienes leen entiendan el hallazgo antes de ir al paper completo.
Convertí un pico repentino, una caída o un cambio de tendencia en una breve narrativa visual que le dé contexto y próximos pasos a las personas clave.
Usá viñetas para hacer que cambios de estado, causa y efecto y relaciones ocultas sean más fáciles de conversar en clase.
Problemas
Los gráficos estáticos pueden ser correctos y aun así no explicar por qué el cambio importa. Lo que falta es una estructura narrativa.
Una división en la red, un pico de churn o una anomalía necesitan una secuencia guiada: qué pasó primero, qué cambió después y qué debería notar quien mira.
Los equipos copian gráficos a decks, anotan capturas de pantalla y reescriben el contexto manualmente, incluso cuando se repite el mismo patrón de explicación todas las semanas.
El estudiantado puede memorizar la forma del gráfico sin entender el proceso detrás. Los cómics le dan al concepto un recorrido visible.
Un hallazgo sólido necesita versiones para charlas, newsletters, redes sociales, updates internos y materiales de clase. Un solo gráfico casi nunca sirve para todo.
Workflow
Usá LlamaGen.AI para pasar de observaciones en crudo a un cómic de gráficos listo para presentar.
01
Traé el gráfico, la captura del chart, el contexto del dashboard o la observación escrita que necesitás explicar.
02
Describí el estado inicial, el disparador, el punto de inflexión y el resultado para que el cómic tenga un arco narrativo claro.
03
Creá viñetas visuales que muestren la progresión y mantengan consistentes las etiquetas de datos, personajes o metáforas.
04
Compartí el cómic en decks, clases, resúmenes de investigación, actualizaciones de producto o formatos de motion comic.
Cada ejemplo combina una necesidad de comunicación de datos con un resultado tipo cómic, para que buscadores y lectores vean el caso de uso real.
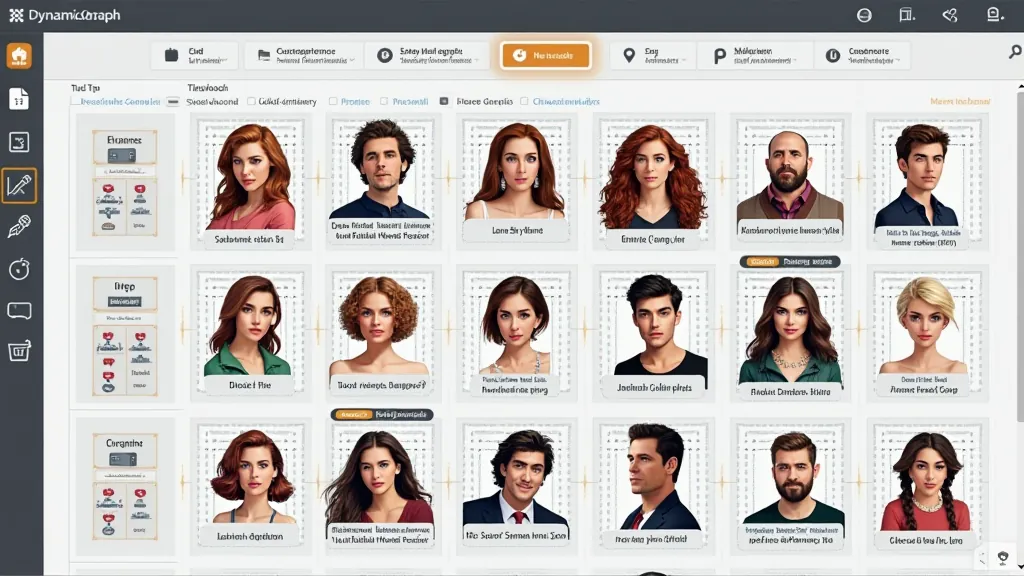
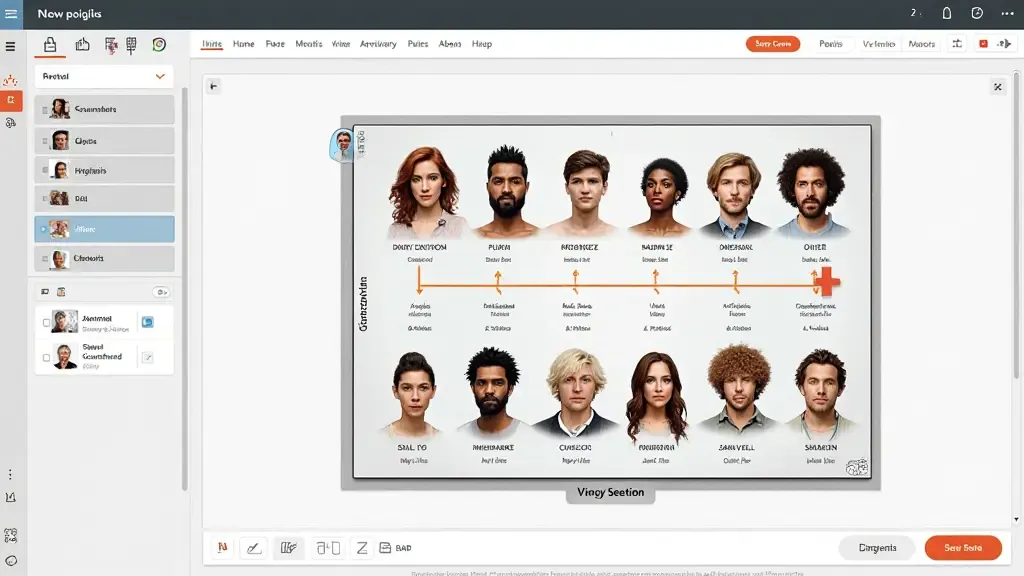
La expansión de una red se muestra como una secuencia de descubrimientos, ayudando a ver cómo surgieron las relaciones con el tiempo.
Turn a dynamic network growth chart into a four-panel comic that explains new clusters forming over time.
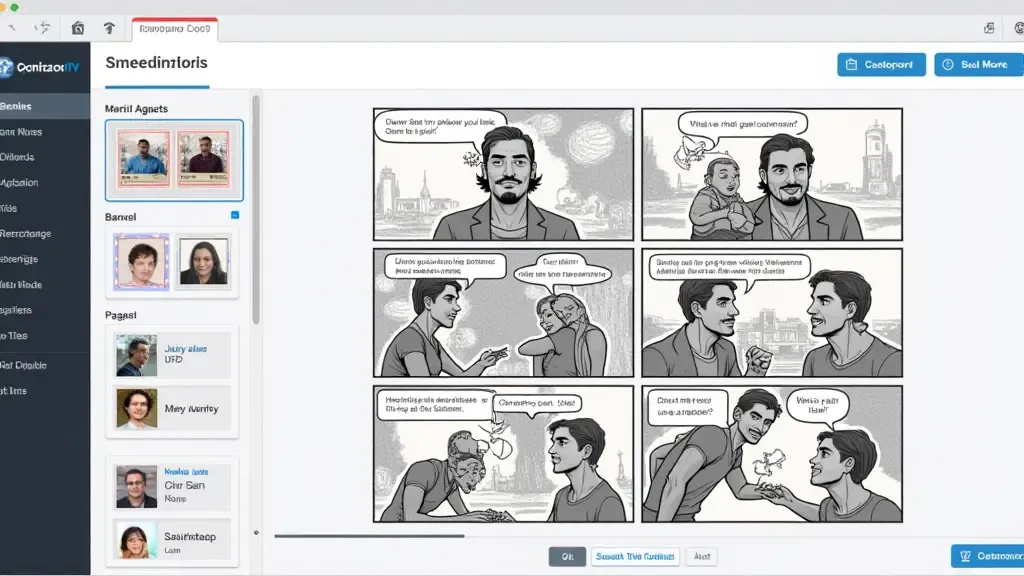
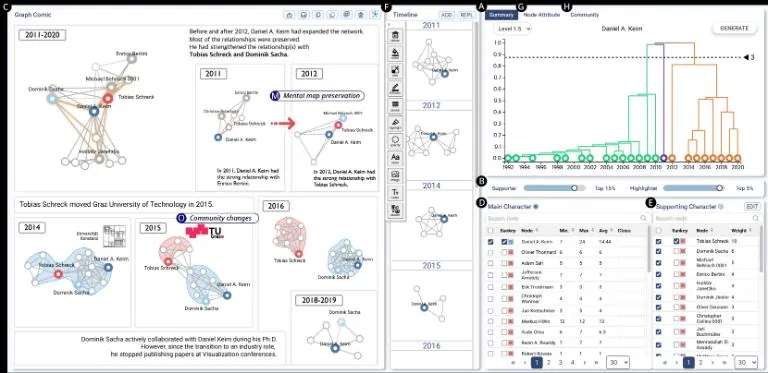
Un resultado de investigación se convierte en una explicación visual que arranca con la pregunta, muestra la señal y cierra con el insight.
Explain a research graph where the pattern changes after a key intervention, using clear visual story beats.
Un cambio en la analítica de producto se reformula como una historia corta sobre qué se movió, qué lo causó y qué revisar después.
Create a comic storyboard from a dashboard trend shift for a weekly product review.
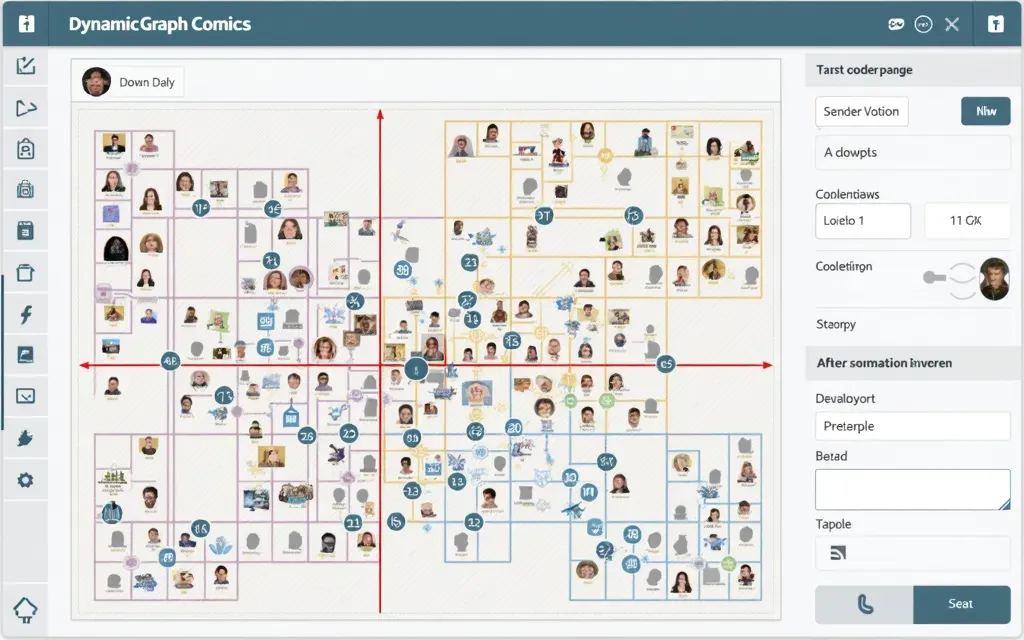
Los nodos conectados del gráfico se transforman en una secuencia de causa y efecto que aclara por qué un evento llevó a otro.
Show how one graph event triggers downstream effects across connected nodes.
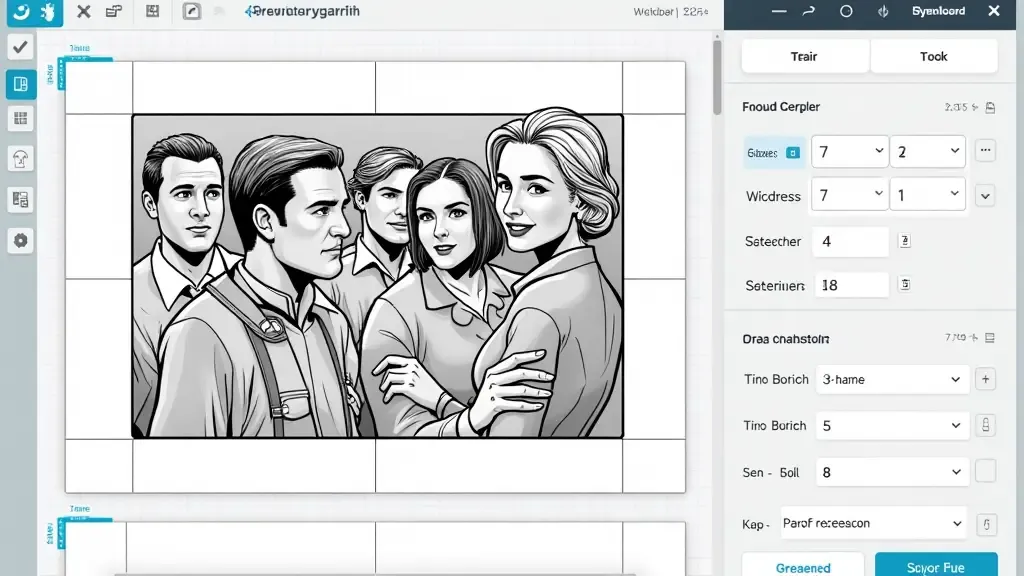
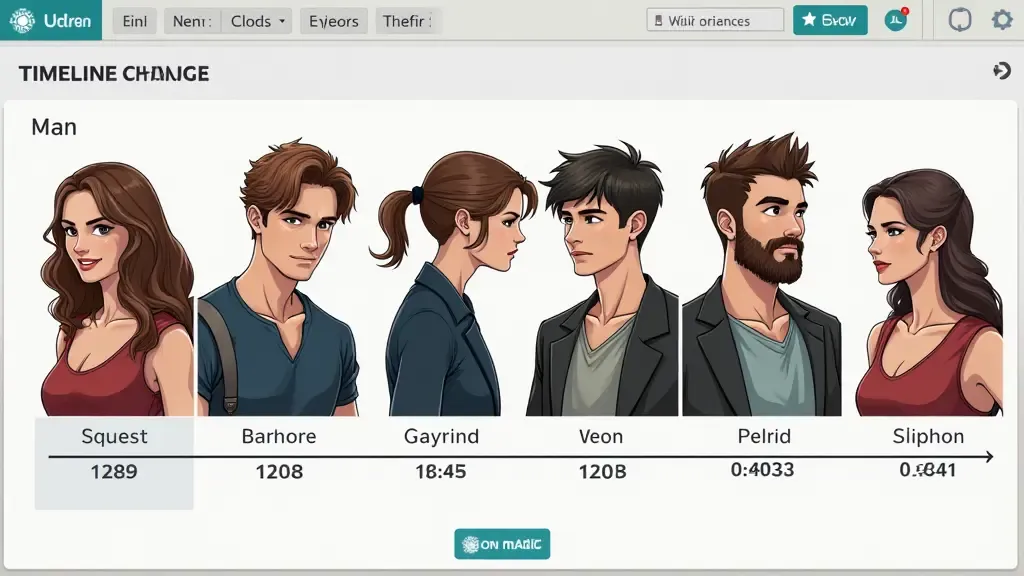
Una clase convierte estados de gráficos abstractos en una secuencia que les estudiantes pueden observar, discutir y recordar.
Create a classroom-friendly graph comic that teaches how a network changes between three states.
Las métricas clave se muestran como una narrativa visual para equipos de producto, marketing y liderazgo.
Explain a product metric drop and recovery with a short comic sequence.
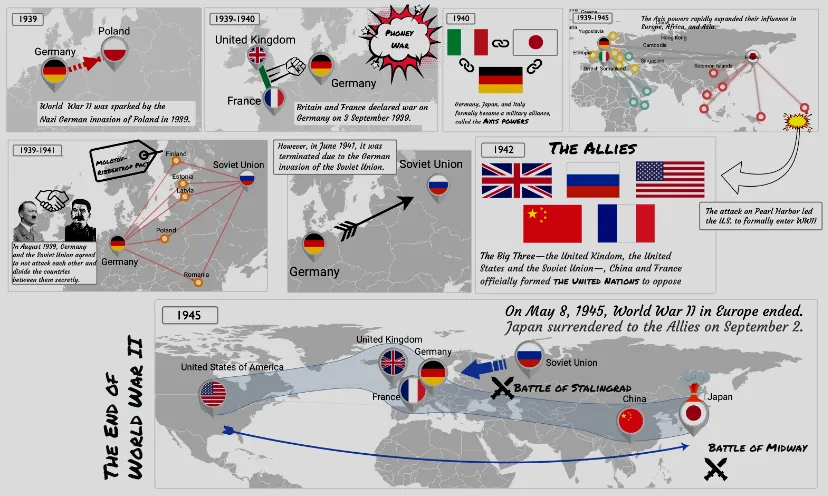
Una línea de tiempo de cambios de estado se convierte en una explicación del incidente viñeta por viñeta para revisión interna.
Turn an operations incident timeline into a visual explanation with impact, response, and resolution.
El movimiento de tendencias importantes se resume en una historia visual concisa para updates a inversores y ejecutivos.
Create an investor-friendly comic that explains growth, risk, and the next milestone from graph data.
Por qué LlamaGen.AI
El valor no está solo en generar una imagen. Está en convertir un cambio de datos dinámicos en un recurso narrativo entendible.
Dividí un cambio complejo en una secuencia de momentos para que quienes leen puedan seguir la lógica.
Creá versiones para presentaciones, materiales de clase, resúmenes de investigación, newsletters y publicaciones en redes.
Mantené metáforas, etiquetas y elementos recurrentes estables entre viñetas para una comprensión más clara.
Extendé cómics de gráficos estáticos a workflows de motion comics o videos explicativos cuando la historia necesita movimiento.
@Maya_Lee
@Sky_Walker
@Cre_Luna
@juaner0211589
@rubem-didini
@refactorordie
@benoitst-laurent
@RealFeatBit
@jake-m
@michael-b
@bill
@sarah-l
@digital-marketer-suresh
@den
@velika
¿No pudiste encontrar algo? Envíanos un mensaje
Descubre cómo LlamaGen.Ai puede transformar tu narrativa y la creación de contenido en diferentes industrias.
La alternativa número uno para usuarios de Wuri. Lee y crea novelas visuales interactivas.
Crea historias interactivas inmersivas con arte estilo anime y narrativas ramificadas.
Herramientas de IA para marketing y comunicación en redes sociales.
Alianzas transformadoras en marketing digital con cómics de IA.
APIs empresariales de cómic para desarrolladores y empresas.