

Keep the math visible
Ask for equations, values, chart labels, or geometric relationships to remain readable instead of hiding the reasoning behind a story.
Math LessonからMath Comicへ
Use a problem, worksheet, worked example, or chart as the source. Build a comic that shows the reasoning step by step, then verify every number and equation.
For fractions, integers, percentages, geometry, charts, pictograms, perimeter and area.
Paste the exact math problem, worked method, data, or worksheet. Include the numbers and vocabulary that must stay unchanged.
Choose a short real-life scenario and map one mathematical idea or calculation step to each panel.
Generate the draft, then verify every equation, number, chart label, and conclusion against the source before sharing it.
Ask for equations, values, chart labels, or geometric relationships to remain readable instead of hiding the reasoning behind a story.
Break a worked 例 into a sequence so students can see how the problem changes from setup to result.
Treat the comic as a visual draft. Recalculate the answer and check the generated wording against the lesson or worksheet.
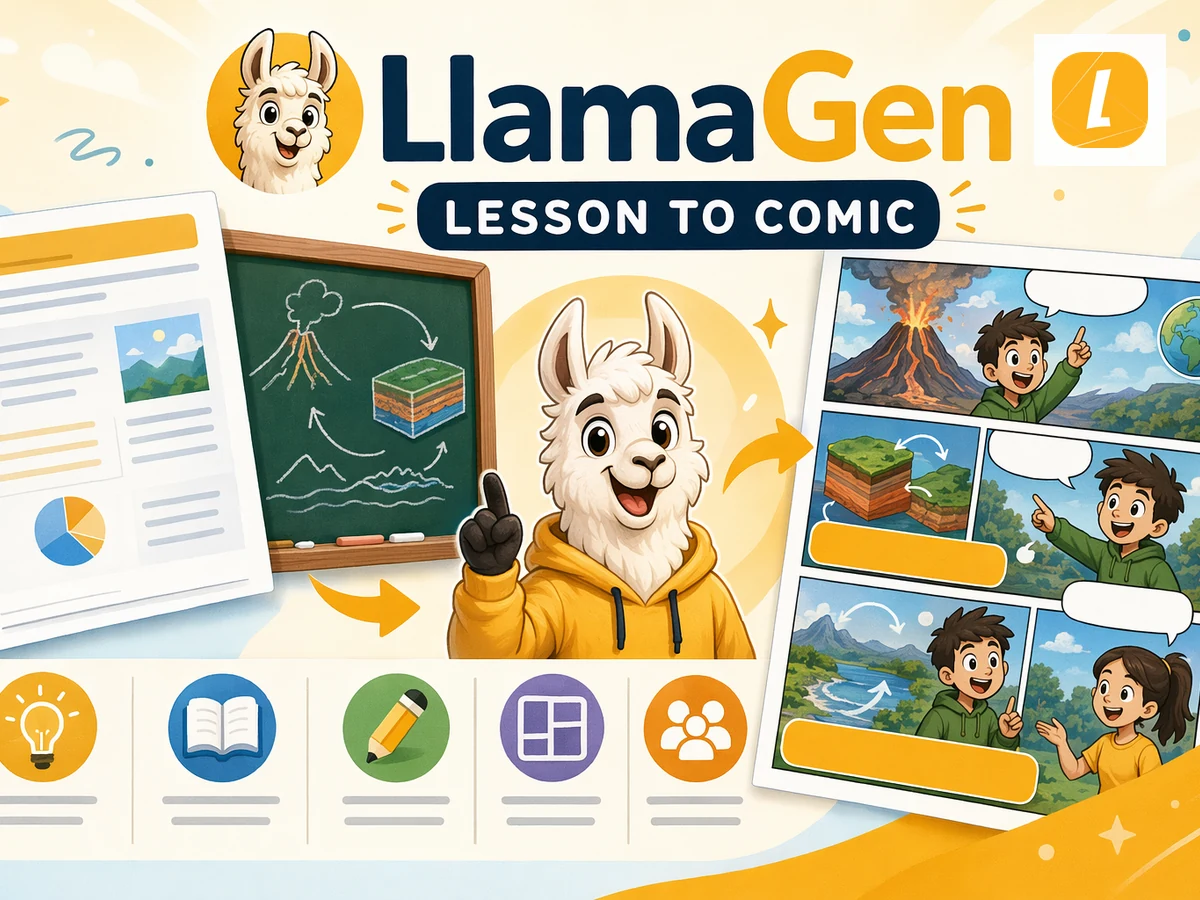
生成前にプランとクレジットを確認するか、1枚の写真をコミック化、コミックストリップメーカーを開く、またはAIコミックストリップから始めましょう。
A math comic generator turns a mathematical concept, problem, worked example, or lesson into sequential visual panels. The goal is to make the reasoning easier to follow, not to replace the source material or the teacher's verification.
Yes. Include the exact numbers and method you want taught. A useful comic gives each panel one clear step and shows the relevant fraction, integer operation, or percentage calculation.
Yes. Supply the original chart values or pictogram key, then ask the comic to show both the visual data and the interpretation. Check every label and conclusion against the source.
Yes. A real-life scenario such as fencing a garden can show why perimeter and area are different. Include the dimensions and expected method so the generated panels do not invent measurements.
No. Recalculate every result and compare the comic with the worksheet, lesson notes, or approved answer key before using it for instruction or assessment.
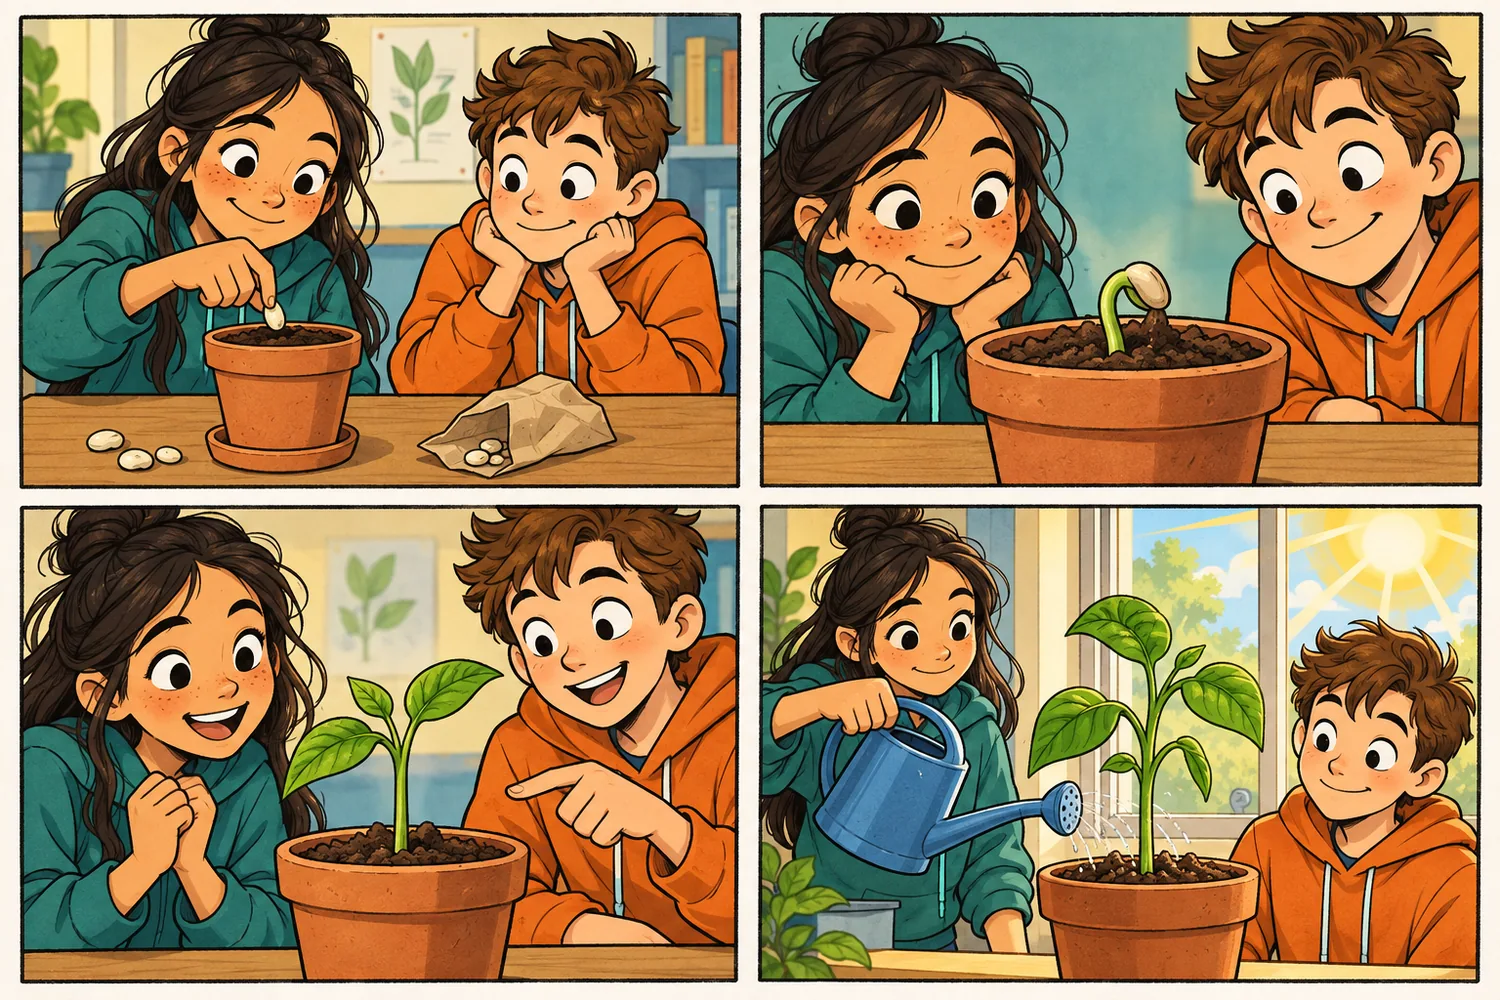
Explore classroom comic workflows, printable templates, and subject-specific learning paths.
Turn an assignment, rubric, or class notes into a student-friendly comic.
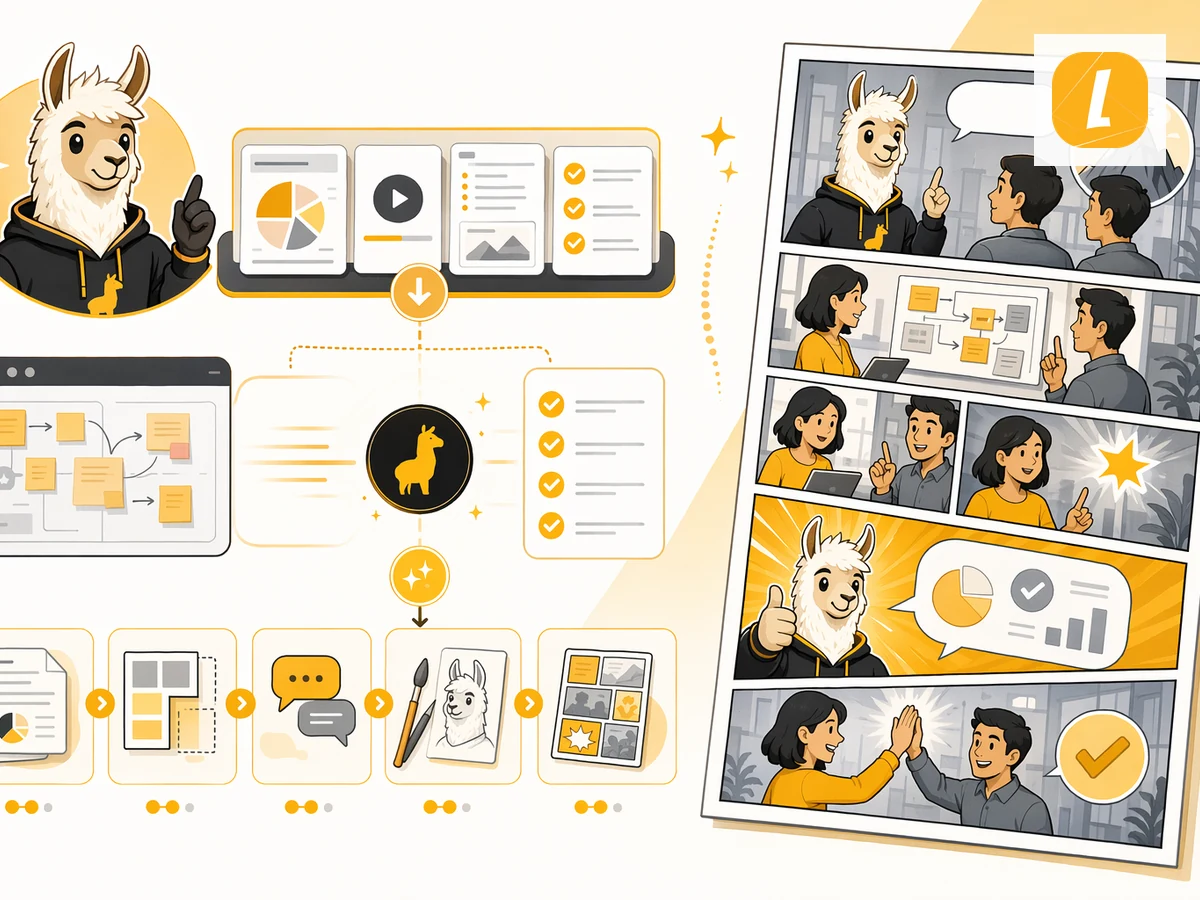
Build a guided comic worksheet from a lesson goal and instructions.
Turn lesson material into visual panels for teaching and review.
1分でコミックを作成。クレジットカード不要。
生成した画像や動画からコミックやマンガ、ストーリーボード、連続したビジュアルストーリーへ展開。